Meaningful Reliability Data – the Challenges associated with Low Utilization Operations

Rustom D. Sutaria – Avia Intelligence, Dubai, 2016
Having completed a number of reliability courses on behalf of Sofema, and advised on reliability programme development, the author is frequently asked about the challenge of low levels of reliability data, and whether there are enough data points in order to produce an adequate analysis. The biggest concern amongst reliability engineers is a somewhat thorny question: ‘how sure am I of my reliability data if I initially determine that corrective action may not be necessary?’
The question is one of the level of confidence that the reliability engineer and ultimately the effected engineering manager in the data that has been produced, presented together with a potential interpretation. Off-course, it stands to reason that if we have more data points relating to a potential issue, then the reliability in any forecast will have a greater level of confidence.
Another question that is often asked is: ‘can I have a meaningful reliability forecast even though I am receiving as little as 2 to 3 data points’. The simple answer is in actual fact – YES. However, (as with everything in aviation) there are special terms and trade-offs.
From the perspective of statistical analysis, reliability engineers can argue the case in a number of ways. Firstly, do the existing data points closely follow a recognized linear or non-linear distribution? In other words, do the dots in a scatter plot close together or do individual data points hug the curve tightly (i.e. little or no variance)? If the answer is YES, then the plot is considered to be strong and in terms of its’ confidence levels, and so with it, any assumptions made as to projected forecasts with regards to failure & wear-out rates. Consider the diagram below.
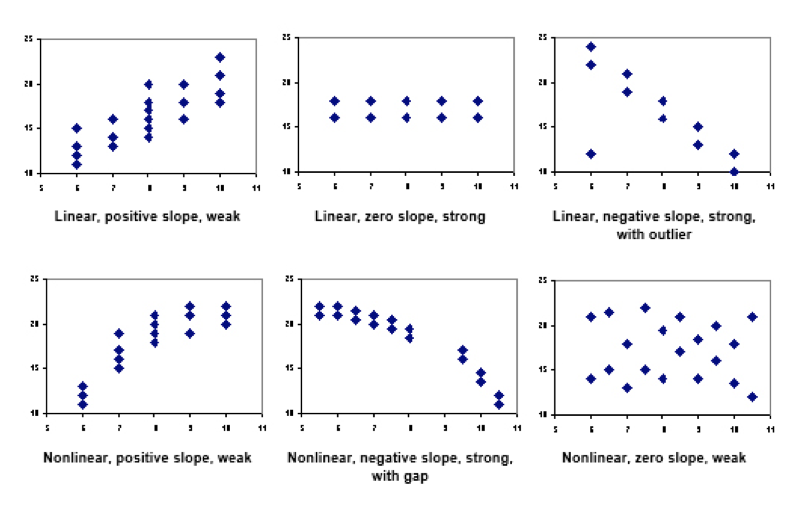
Consequent, if the dots in a scatter plot are further apart or individual data points do not hug the curve tightly (i.e. significant variance), then the plot is considered to be weak in terms of its’ confidence levels, and so with it, any assumptions made as to projected forecasts with regards to failure & wear-out rates.
In the latter situation, either more data needs to be introduced (possibly from the OEM or another source), or a different approach must be implemented to provide confident results. In increasingly popular approach that provides a higher level of confidence with low levels of data involves Weibull Analysis.
Weibull Analysis
Weibull tells the engineer/analyst whether or not scheduled inspections and overhauls are needed. The technique accomplishes this by employing the Weakest Link in the Chain Concept, by studying individual failure modes of a component or system with a view to identification of the earliest point of failure – the proverbial weakest link. Consider the diagram opposite:
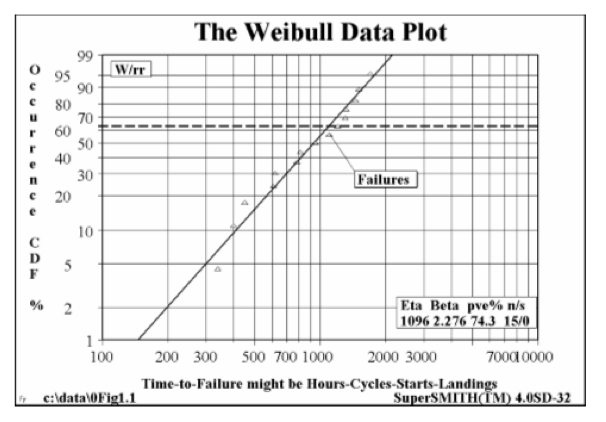
The plot above provides the engineer/analyst with a direct interpretation of forecasted failure by comparing a measure of Life or ageing with a ‘Cumulative Distribution function’ (CDF) which describes likelihood of failure occurrence as a percentage.
An interpretation or forecast of reliability is then simply: Reliability = 100 – CDF
Considered by most engineers as a relatively simplistic technique, Weibull Analysis is useful for both large and small samples, even just two or three failures would provide a highly meaningful engineering analysis!!
Generally speaking, Moderate size samples, twenty or more failures, are needed to accurately discriminate between the Weibull and other distributions.
Other advantages:
- Small samples also allow cost effective component testing.
- Provides a simple and useful graphical plot of the failure data.
- Weibull analysis may still be useful even with inadequacies in the data. (Even bad Weibull plots are usually informative to engineers trained to read them.)
Conclusion
In context of organisations involved with low utilization of their fleet, whom are worried about adequacy and confidence levels of their forecasted reliability data, there are approaches that can be utilized to raise the confidence level through numerous techniques. Generally speaking, component reliability analysis that involve less than 20 failures against a particular failure mode, then Weibull Analysis is the best choice, and therefore, best practice. However, this is not a blanket rule, as data points must closely conform with the recognised distribution curves (both linear & non-linear). If the data does not, then other techniques may need to be resorted to.
